Benchmarking Kafka Message Queue Latency
Summary
The purpose of this blog is to show the results of messaging queue latency using Kafka.
The testing to measure the latency is achieved by making use of kafka library written in c language and installing kafka in cluster mode with zookeeper to manage configuration.
Kafka default configuration was modified to achieve this result(See Kafka Producer and Consumer Configurations section)
The latency is measured by sending messages effectively in variable rate , received them by consumer and recorded the end to end latency at consumer end.
The first test was done only running producer and consumer without generating traffic on the same bus. And then modified test to capture latency with added bus traffic with various speed and configuration changes.
In overall test result, it shows that kafka is good candidate for low latency messaging in comparison with rabbitMQ and and other messaging service.
Also was noted that , Kafka latency gets hit when more partitions are added to the topic.
More partitions and more replication factors increases latency.
Here Event topic is created with 1 partitions and 3 replication factor with guaranteed message delivery to consumer and Telemetry or general traffic topic is created without any replication.
Conclusion
Based on various test result, the high latency achievable setup is to have
- EVENT, topic created with single partition and Replication factor equal to no of brokers in Cluster, with batch size of 0, and acknowledgement set to 1.
- TRAFFIC, topic created with partitions number equal to no of nodes and each producer generating messages with unique partition key with acknowledgement set to 0 and batch size set to 0.
- TRAFFIC message are generated at the rate of <=1 sec
- EVENT traffic generated as and when event is captured
- TRAFFIC consumer are grouped by same groupid(high performance)
- EVENT consumer are unique instances without any groupid assigned
Comparing EVENT latency for different acknowledgment setting with Metrics Topic partitioned with Key name and without key name
ACK 1:Metrics without key
|
ACK -1: Metrics without key
|
ACK 1: Metrics With Key
|
ACK -1 Metrics With Key
|
17.51
|
14.474
|
2.29
|
2.107
|
117.604
|
23.138
|
2.5155
|
2.3135
|
229.4404
|
224.7512
|
4.0073
|
3.5732
|
427.1938112
|
408.2698984
|
19.0023534
|
17.4909006
|

Comparing different acknowledgment setting without any metrics
Percentile
|
(*)No Metrics 1P/3RF-ACK(-1)
|
(**) No Metrics -1P/3RF- ACK(0)
|
(**) No Metrics -1P/3RF- ACK(1)
|
0.9
|
2.43
|
1.88
|
1.91
|
0.95
|
2.625
|
1.93
|
1.96
|
0.99
|
3.671
|
2.0464
|
2.04
|
0.99999
|
16.609606
|
6.1931184
|
11.7625396
|

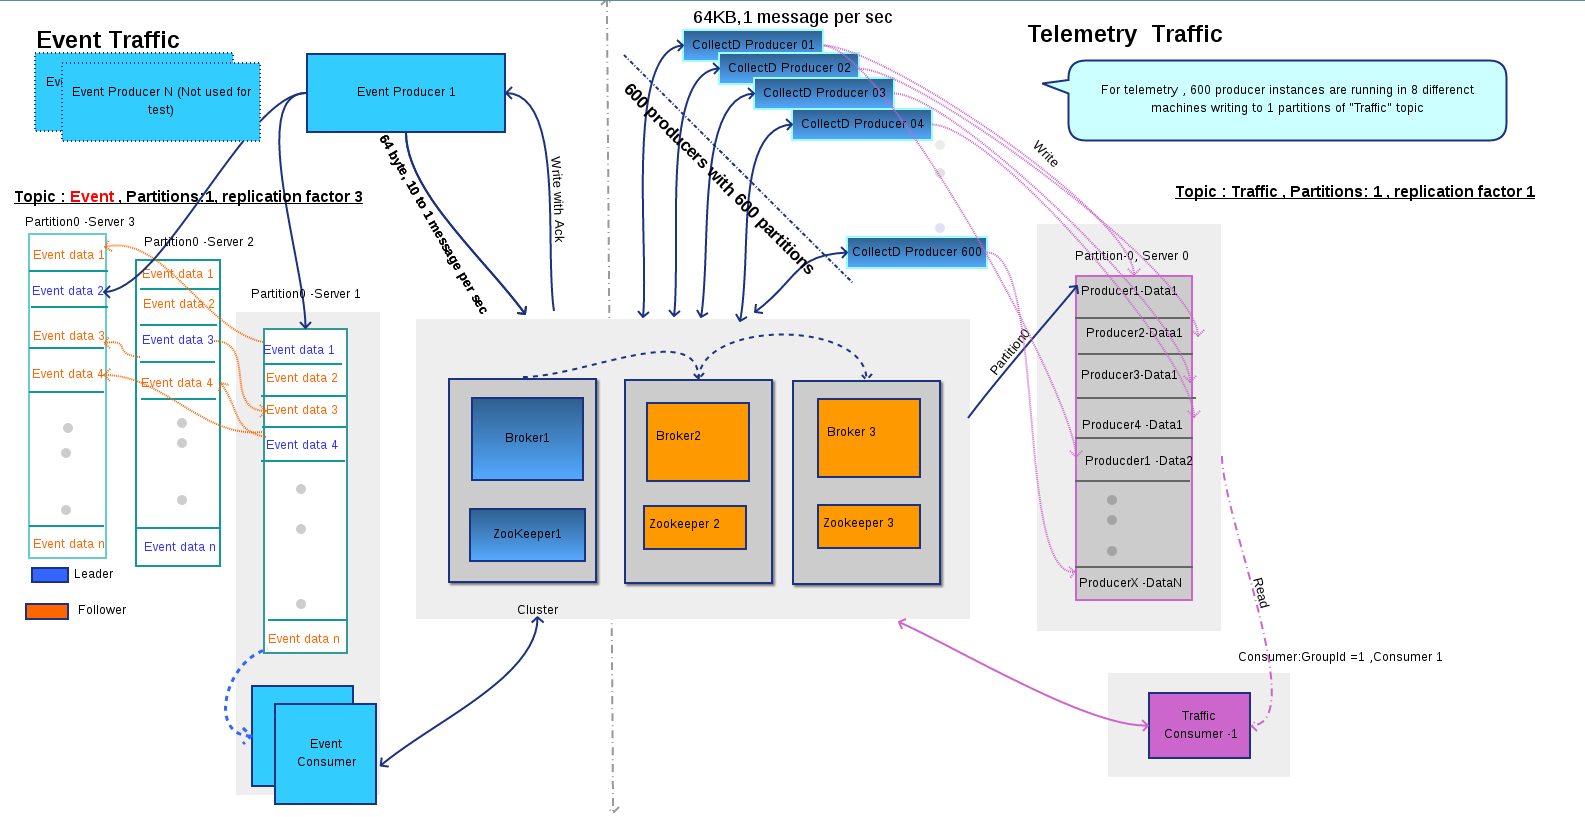
Setup
Kafka is installed in cluster mode , with zookeeper running as 3 (n-1) node cluster and 3 brokers (n-1) availability mode and auto-create topics with 3 partition, so we can have 3 client for each topic per group.
For testing purpose we have use two topics “EVENT” and “TRAFFIC”
Kafka Topic
Every topic partition in Kafka is replicated n times, where n is the replication factor of the topic. This allows Kafka to automatically failover to these replicas when a server in the cluster fails so that messages remain available in the presence of failures.
EVENT Topic : Used to capture events via collectd D, this topic is created with 1 Partitions and 3 replication factor.
TRAFFIC Topic: This topic is used for telemetry data . This load on the event producers and consumers are tested with various combination of traffic topics
Events latency measured with
- Traffic topic of 1 partition and 1 replication factor
- Trafic topic with 700 partitions and 1 replication factor
- Traffic topic with 700 partitions with keyname and 1 replication factor
Important Client / Producer Configurations:
Kafka Producer and Consumer Configurations
In order to achieve low latency, following configuration are required for producer and consumers.
For more details about configurations , please refer to this link
Producer
/* Producer config */
rd_kafka_conf_set(conf, "queue.buffering.max.messages", "500000",NULL, 0);
rd_kafka_conf_set(conf, "queue.buffering.max.ms", "0",NULL, 0);
rd_kafka_conf_set(conf, "batch.num.messages", "0",NULL, 0);
rd_kafka_conf_set(conf, "message.send.max.retries", "3", NULL, 0);
rd_kafka_conf_set(conf, "retry.backoff.ms", "0", NULL, 0);
rd_kafka_conf_set(conf, "offset.store.method", "broker", NULL, 0);
Consumer
rd_kafka_conf_set(conf, "queued.min.messages", "1000000", NULL, 0);
rd_kafka_conf_set(conf, "session.timeout.ms", "12000", NULL, 0);
rd_kafka_conf_set(conf, "fetch.wait.max.ms", "10000", NULL, 0);
rd_kafka_conf_set(conf, "fetch.error.backoff.ms", "0", NULL, 0);
rd_kafka_conf_set(conf, "fetch.min.bytes","1",NULL,0);
rd_kafka_conf_set(conf, "num.consumer.fetchers","10",NULL,0);
The most important producer configurations:
compression
The compression type for all data generated by the producer. The default is none (i.e. no compression). Valid values are none, gzip, snappy, or lz4. Compression is of full batches of data, so the efficacy of batching will also impact the compression ratio (more batching means better compression).
Name: compression.type Default: None
sync vs async production
Batching is one of the big drivers of efficiency, and to enable batching the Kafka producer will attempt to accumulate data in memory and to send out larger batches in a single request.
Name: producer.type Default: sync
batch size (for async producers)
A small batch size will make batching less common and may reduce throughput (a batch size of zero will disable batching entirely). A very large batch size may use memory a bit more wastefully as we will always allocate a buffer of the specified batch size in anticipation of additional records.
Name: batch.size Default: 0
maximum message size
This is largest message size Kafka will allow to be appended to this topic. Note that if you increase this size you must also increase your consumer's fetch size so they can fetch messages this large.
Account for this when doing disk sizing. Average Message size+Retention Period * Replication factor
Name: max.message.bytes Default: 1,000,000
Acks
The topic is tested for different acks setting . Acks =1 is ideal case to improve latency .
The number of acknowledgments the producer requires the leader to have received before considering a request complete. This controls the durability of records that are sent. The following settings are common:
acks=0 If set to zero then the producer will not wait for any acknowledgment from the server at all. The record will be immediately added to the socket buffer and considered sent. No guarantee can be made that the server has received the record in this case, and the configuration will not take effect (as the client won't generally know of any failures). The offset given back for each record will always be set to -1.
acks=1 This will mean the leader will write the record to its local log but will respond without awaiting full acknowledgement from all followers. In this case should the leader fail immediately after acknowledging the record but before the followers have replicated it then the record will be lost.
acks=all This means the leader will wait for the full set of in-sync replicas to acknowledge the record. This guarantees that the record will not be lost as long as at least one in-sync replica remains alive. This is the strongest available guarantee.
Name: acks Default: 1
Number of partitions for a topic
Number of topics and partitions impact how much can be stored in page cache
Topic/Partition is unit of parallelism in Kafka
Partitions in Kafka drives the parallelism of consumers
For “EVENT” topic partition is set to 1 and for “Telemetry” or “Traffic” partition is equal to number for producers.
Java/JVM tuning
- Minimize GC pauses by using Oracle JDK it uses new G1 garbage-first collector
- Kafka Heap Size
- From HCC Article, by default kafka-broker jvm is set to 1Gb this can be increased using Ambari kafka-env template. When you are sending large messages JVM garbage collection can be an issue. Try to keep the Kafka Heap size below 4GB.
- Example: In kafka-env.sh add following settings.
- export KAFKA_HEAP_OPTS="-Xmx16g -Xms16g"
- export KAFKA_JVM_PERFORMANCE_OPTS="-XX:MetaspaceSize=96m -XX:+UseG1GC -XX:MaxGCPauseMillis=20 -XX:InitiatingHeapOccupancyPercent=35 -XX:G1HeapRegionSize=16M -XX:MinMetaspaceFreeRatio=50 -XX:MaxMetaspaceFreeRatio=80"
Software
Installed versions.
Java-1.8.0-openjdk-devel.x86_64
Scala-2.10.3
Kafka_2.10-0.10.0.1
Broker listening at port 9092
Server Details
MemTotal: 131744948 kB
Architecture: x86_64
CPU op-mode(s): 32-bit, 64-bit
Byte Order: Little Endian
CPU(s): 48
On-line CPU(s) list: 0-47
Thread(s) per core: 2
Core(s) per socket: 12
Socket(s): 2
NUMA node(s): 2
Vendor ID: GenuineIntel
CPU family: 6
Model: 79
Model name: Intel(R) Xeon(R) CPU E5-2650 v4 @ 2.20GHz
Stepping: 1
CPU MHz: 1682.484
BogoMIPS: 4411.71
Virtualization: VT-x
L1d cache: 32K
L1i cache: 32K
L2 cache: 256K
L3 cache: 30720K
NUMA node0 CPU(s): 0-11,24-35
NUMA node1 CPU(s): 12-23,36-47
Test Case
- (*)Event Producers publishes event data to “EVENT” topic at variable rate (1 to 10 messages per sec) of size 64 bytes. Message requires Acknowledgement from the broker before it is made available to consumers.(Brokers needs to complete writing to all replicated servers in the cluster)
- Event Consumers are run in simple mode, Each consumer are run without group.
- Traffic Producers publishes traffic 64KB sized data, every 1 sec(also test for 5 sec interval)
- Traffic consumers are run under single group id, so brokers evenly distributes partitions to consumers.(High performance consumer)
- In simple consumers, TRAFFIC consumers are run without groupid
- Latency for Events is measured under following scenario
- 1 even producers with acks(-1) and 1 event consumers
- Topic partition set to 1 and replication factor 3 , message size 64bytes
- 1 even producers with acks(0) and 1 event consumers
- Topic partition set to 1 and replication factor 3 , message size 64bytes
- 1 even producers with acks(1) and 1 event consumers (default)
- Topic partition set to 1 and replication factor 3 , message size 64bytes
- Run 1 event produces (*) and 1 event consumer
- Without any other traffic on the same bus.
- Run 1 Traffic Producer and 1 Traffic Consumer at 1 sec and 5 sec interval to “TRAFFIC” topic with 1 partition and 1 replication factor
- Run 600 Traffic Producer and 4 Traffic Consumer at 1 sec and 5 sec interval to “TRAFFIC” topic with 500 partition and 1 replication factor
- Run 700 Traffic Producer and 4 Traffic Consumer at 1 sec and 5 sec interval to “TRAFFIC” topic with 700 partition with unique keyname for each partition and 1 replication factor.
- Run 1 event produces with ack (1) and 1 event consumer(default)
- Run 700 Traffic Producer and 4 Traffic Consumer at 1 sec and 5 sec interval to “TRAFFIC” topic with 700 partition and 1 replication factor
Installing Kafka and ZooKeeper
- Install java Java-1.8.0-openjdk-devel.x86_64
- Install scala
- wget http://www.scala-lang.org/files/archive/scala-2.10.3.rpm -O scala-2.10.3.rpm
- rpm -ivh scala-2.10.3.rpm
- Download Kafka
- wget http://www.us.apache.org/dist/kafka/0.10.0.1/kafka_2.10-0.10.0.1.tgz -O kafka_2.10-0.10.0.1.tar.gz
- tar -xvzf kafka_2.10-0.10.0.1.tar.gz
- mv kafka_2.10-0.10.0.1 /usr/share/kafka
- Update iptables on all brokers(Kafka installed server)
- iptables -I INPUT -p tcp -m tcp --dport 3888 -m comment --comment 'zookeeper 3888' -j ACCEPT
- iptables -I INPUT -p tcp -m tcp --dport 2888 -m comment --comment 'zookeeper 2888' -j ACCEPT
- iptables -I INPUT -p tcp -m tcp --dport 2181 -m comment --comment 'zookeeper 2181' -j ACCEPT
- /sbin/service iptables save
- Refer changes for zookeeper and server propers from here
- https://gist.github.com/aneeshkp/013d51cdc64606079835319d3e70061e
- Configure Zookeeper
- touch /var/zookeeper/data/myid
- echo 1 >> /var/zookeeper/data/myid
- Run zookeeper from command line
$cd /usr/share/kafka/
$bin/zookeeper-server-start.sh config/zookeeper.properties
(to run as service)
[Unit]
Description=Zookeeper Service
[Service]
Type=simple
User=root
ExecStart= /usr/share/kafka/bin/zookeeper-server-start.sh /usr/share/kafka/config/zookeeper.properties
[Install]
WantedBy=multi-user.target
Description=Zookeeper Service
[Service]
Type=simple
User=root
ExecStart= /usr/share/kafka/bin/zookeeper-server-start.sh /usr/share/kafka/config/zookeeper.properties
[Install]
WantedBy=multi-user.target
- Run Kafka
- $cd /usr/share/kafka/
- $ bin/kafka-server-start.sh config/server.properties
- Create Topic for testing
- Event topic
- sh kafka-topics.sh --create --zookeeper 10.19.110.7:2181,10.19.110.9:2181,10.19.110.11:2181 --partition 3 --replication-factor 3 --topic EVENT
- Traffic Topic
- Single partition 1 replication factor
- sh kafka-topics.sh --create --zookeeper 10.19.110.7:2181,10.19.110.9:2181,10.19.110.11:2181 --partition 1 --replication-factor 1 --topic TRAFFIC
- 700 partitions 1 replication factor
- sh kafka-topics.sh --create --zookeeper 10.19.110.7:2181,10.19.110.9:2181,10.19.110.11:2181 --partition 700 --replication-factor 1 --topic TRAFFIC700
Test Client and Scripts
C client library librdkafka is used for testing latency . https://github.com/edenhill/librdkafka
librdkafka - the Apache Kafka C/C++ client library. ibrdkafka is a C library implementation of the Apache Kafka protocol, containing both Producer and Consumer support.
Kafka is written in scala and java client performs better than python client, but according to Confluent C++ library performs better than java and hence we opted to use C library instead of java client.
Python Client
There are three major python clients for kafka pykafka, python-kafka and confluent-kafka-client You can refer to those clients here
http://activisiongamescience.github.io/2016/06/15/Kafka-Client-Benchmarking/
All available clients
Benchmarking reference
Source for scripts used for testing.
Source
- Used modified version for client example from librdkafka c library
Download librdkafka library from https://github.com/edenhill/librdkafka and copy rdkafka_performance4.c and rdkafka_performance3.c to src folder and compile
For event producer and consumer
$gcc -lrdkafka -lz -lpthread -lrt rdkafka_performance4.c -o rdkafka_performance4
For traffic producer and consumer
$gcc -lrdkafka -lz -lpthread -lrt rdkafka_performance3.c -o rdkafka_performance3
2. set the environmental variable LD_LIBRARY_PATH
LD_LIBRARY_PATH=/usr/local/lib
:q
export LD_LIBRARY_PATH
3.Create topics in brokers (** explained in installation steps)
>login to broker server and navigate to bin folder
sh kafka-topics.sh --create --zookeeper localhost:2181 --replication-factor 3 --partitions 3 --config retention.ms 12000 --topic telemetry_topic
EVENT
- Event Producer script
$~/librdkafka/src/rdkafka_performance4 -P -t EVENT -a -1 -b 10.19.110.7:9092,10.19.110.9:9092,10.19.110.11:9092 -c 5000 -l -s 64
Arguments
-P is for producer
-t TOPIC_NAME
-a -1 , required acks
-b list of brokers
-c message count
-l latency stats
-s size of message
- Event Consumer script
$~/librdkafka/src/rdkafka_performance4 -C -t topic_name -p 0 -o end -b 10.19.110.7:9092,10.19.110.9:9092,10.19.110.11:9092 -u -l
Arguments:
-C consumer
-t topic_name
-p 0 , partition since we create EVENT topic with one partition , consumer will only consume from partition0
-u Output stats in table format
TRAFFIC
- Traffic Producer script. On each server creates 100 producers
for i in $(1..100); do
~/rdkafka_performance3 -P -t traffic_topic_name -M -a 0 -b 10.19.110.7:9092,10.19.110.9:9092,10.19.110.11:9092 -B 1 -r 1 -s 64000;
done
2. Traffic Consumer script
~/rdkafka_performance3 -G group-id-t traffic_topic_name -o end -b 10.19.110.7:9092,10.19.110.9:9092,10.19.110.11:9092 -u -l
-G groupid , has to be same for all consumers , so that brokers can balance partitions among consumers(Consumers cannot be more than partitions)
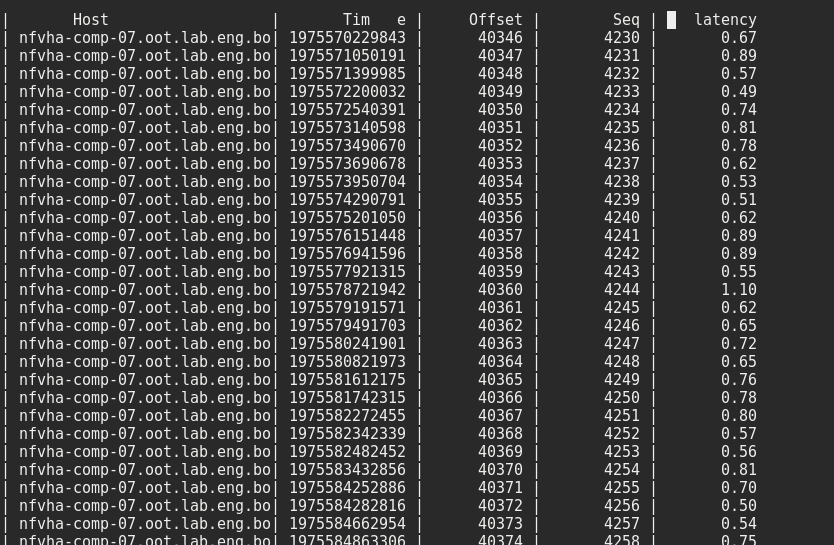
Measuring Latency
Message latency is measured by adding wall_clock to the message before sending to broker and consumer prints difference on arrival.
With No Traffic
Here Event latency is measured without any telemetry type of traffic is generated in the background while measuring latency .
In this test case, no traffic producers and consumer were running. Single producer and single consumer is running with EVENT topic is created with 1 partitions and 3 replication factor.
With different Acknowledgement factor
Producer
$~/librdkafka/src/rdkafka_performance4 -P -t EVENT -a -1 -b 10.19.110.7:9092,10.19.110.9:9092,10.19.110.11:9092 -c 5000 -l -s 64
Consumer
$~/librdkafka/src/rdkafka_performance4 -C -t topic_name -p 0 -o end -b 10.19.110.7:9092,10.19.110.9:9092,10.19.110.11:9092 -u -l
1 partition, 3 Replication factor comparing with 3 different types of acknowledgment setting
Percentile
|
1P/3RF-ACK(-1)
|
1P/3RF- ACK(0)
|
1P/3RF- ACK(1)
|
0.9
|
2.43
|
1.88
|
1.91
|
0.95
|
2.625
|
1.93
|
1.96
|
0.99
|
3.671
|
2.0464
|
2.04
|
0.99999
|
16.609606
|
6.1931184
|
11.7625396
|

ACK(-1) : 1 partition 3 RF
acks=-1 This means the leader will wait for the full set of in-sync replicas to acknowledge the record. This guarantees that the record will not be lost as long as at least one in-sync replica remains alive. This is the strongest available guarantee.
")
")
ACK(0) : 1 partition 3 RF
acks=0 If set to zero then the producer will not wait for any acknowledgment from the server at all. The record will be immediately added to the socket buffer and considered sent. No guarantee can be made that the server has received the record in this case, and the configuration will not take effect (as the client won't generally know of any failures). The offset given back for each record will always be set to -1.
")
")
ACK(1) : 1 partition 3 RF
acks=1 This will mean the leader will write the record to its local log but will respond without awaiting full acknowledgement from all followers. In this case should the leader fail immediately after acknowledging the record but before the followers have replicated it then the record will be lost.
")
")
Comparing between Replication Factor set to 1 and 3

With Traffic
Here Event latency is measured with various types of telemetry type of traffic is generated in the background while measuring latency .
Comparing Latency with different types of traffic in the background with ACK(-1) and ACK(1)
Event Latency measured with the traffic with Event ACK set to all (-1)
To generate different traffic , “Telemetry” topic was created with
- Single partition and single Replication factor
- 700 Partition and Single Replication factor
TRAFFIC: 7 Producers , 4 Consumers , Topic :Single partition and single Replication factor.
Consumers are consuming topic as individual instance. Every consumer reads all offsets of the topic.
Event Topic Latency chart

")

TRAFFIC: 7 Producers at 1 msg/sec , 4 simple Consumers , Topic :700 partition with single Replication factor.

Test setup to measure EVENT latency with traffic producers and simple traffic consumers running in multiple partitions and instances mode. In Simple consumers, each instance belong to its own group, hence each consumer will subscribe to all partitions(700 Partitions)


TRAFFIC: 700 Producers at 1 msg/sec , 4 high performance Consumers , Topic :700 partition with single Replication factor.
Test setup to measure EVENT latency with traffic producers and high performance consumers running in multiple partitions and instances mode
X Traffic Producers writing to Y partitions with Z<=Y Consumers consuming messages.
In our test we used 600 producers with 700/500 partitions with key and without key.
Without partition Key


With partition key


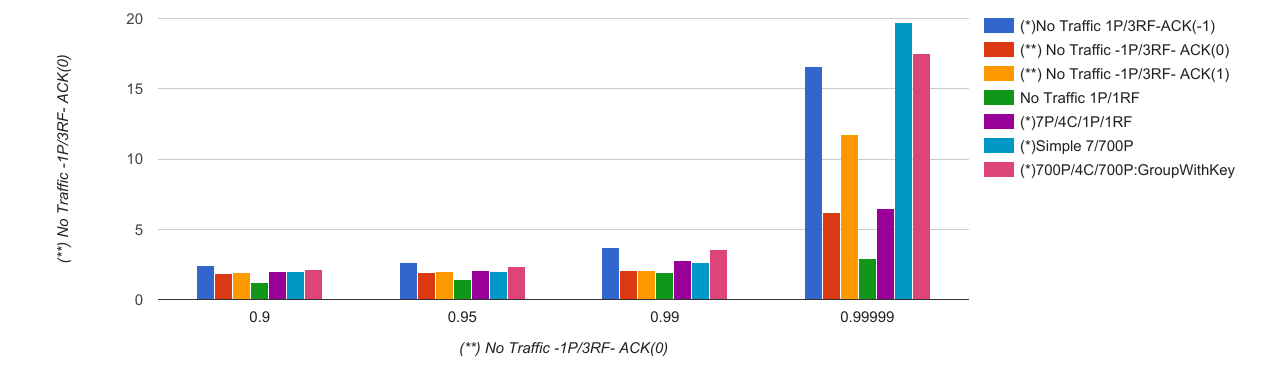
Comparing Traffic
Percentile
|
(*)No Traffic 1P/3RF-ACK(-1)
|
(**) No Traffic -1P/3RF- ACK(0)
|
(**) No Traffic -1P/3RF- ACK(1)
|
No Traffic 1P/1RF
|
(*)7P/4C/1P/1RF
|
(*)Simple 7/700P
|
(*)700P/4C/700P:Group
|
(*)700P/4C/700P:GroupWithKey
|
0.9
|
2.43
|
1.88
|
1.91
|
1.183
|
1.99
|
1.96
|
14.474
|
2.107
|
0.95
|
2.625
|
1.93
|
1.96
|
1.4025
|
2.0805
|
2.02
|
23.138
|
2.3135
|
0.99
|
3.671
|
2.0464
|
2.04
|
1.9384
|
2.7524
|
2.6372
|
224.7512
|
3.5732
|
0.99999
|
16.609606
|
6.1931184
|
11.7625396
|
2.9245569
|
6.4719637
|
19.7113523
|
408.2698984
|
17.4909006
|
Latency collected with traffic for Event with ACK all (1)
TRAFFIC: 700 Producers at 1 msg/sec , 4 high performance Consumers , Topic :700 partition with single Replication factor.
Without Unique Partition key for “TRAFFIC” topic messages produced by 700 producers and consumed by 4 consumer under same group (high performance).


With Unique Partition key for “TRAFFIC” topic topic messages produced by 700 producers,
consumed by 4 consumer under same group (high performance).


Comparing Traffic with ACK(-1) and ACK(1) with 700 partitions with message producer using UNIQUE partition key and without UNIQUE partition key
Comparison of Latency of “EVENT” topic produced with acknowledgment set to all(-1), and broker (1) , with “TRAFFIC” topic partition to 700 and message produced with UNIQUE partition key and Without UNIQUE partition key

ACK 1:Metrics without key
|
ACK -1: Metrics without key
|
ACK 1: Metrics With Key
|
ACK -1 Metrics With Key
|
17.51
|
14.474
|
2.29
|
2.107
|
117.604
|
23.138
|
2.5155
|
2.3135
|
229.4404
|
224.7512
|
4.0073
|
3.5732
|
427.1938112
|
408.2698984
|
19.0023534
|
17.4909006
|