Monday, November 19, 2018

Openshift on Openstack : Resize attached docker volumes for Openshift nodes 

Recently I deployed Openshift 3.9 on Openstack 10z and had ansible variable for docker volume set to 15GiB, later onceI started deploying containers ,I quickly ran out of space in docker volume and couldn’t access openshift console etc .
set openshift_openstack_docker_volume_size: “15”.
Little intro to Docker Volume in Openshift nodes
set openshift_openstack_docker_volume_size: “15”.
The master and node instances contain a volume to store docker images. The purpose of the volume is to ensure that a large image or container does not compromise node performance or abilities of the existing node.
The docker volume is created by the OpenShift Ansible installer via the variableopenshift_openstack_docker_volume_size.
Like in my case I needed to resize the docker volume without tearing down and redeploying Openshift.
The following process to resize a volume can be applied to any volume resize situation. I am just stating my scenario and experience in Openshift deployment.
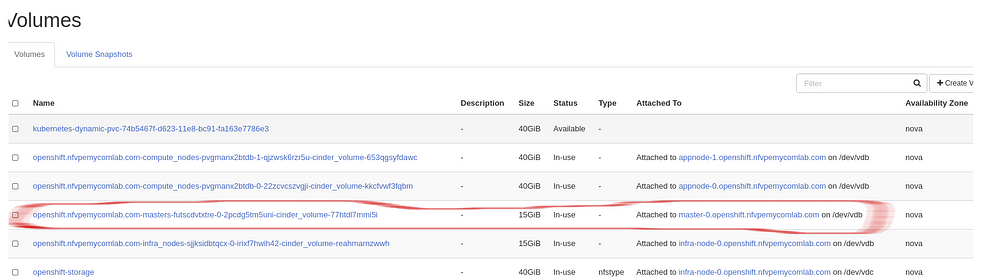
Here you can see the highlighted volume is attached to a master node and it is set to 15GiB.


With df -h command on master node we see that volume is full and Openshit performance will be degraded due to lack of space to run containers on this volume.(Example , Openshift console may not respond).
df -h
...
/dev/mapper/docker — vol-dockerlv is created with 15Gib

df -h

Running Volume list will show , cinder volume in use and attached to master node with 15Gb

openstack volume list

Now I need to increase the volume size to 40Gib. Now this can be done two ways. At this time I am not sure which one is safer to do.
  1. By creating new partition and extending the volume group to include the new logical volume from the new partition.
  2. Or b y deleting the existing partition and recreating the new partition (hoping it starts from same sector block) with new size of 40GiB

Step one, First we need to resize the volume in cinder.

open stack volume list and Openstack server list to identify volume id and server id that is attached to

volume id: 3f382414-b6ed-4499–8b06-a3fa6794c532
server id :68e9c4ba-1ad7–44f8-bb76–053ba1efa5fa
Stop the server and remove the volume list
openstack server stop 68e9c4ba-1ad7–44f8-bb76–053ba1efa5fa
openstack server remove volume 68e9c4ba-1ad7–44f8-bb76–053ba1efa5fa 3f382414-b6ed-4499–8b06-a3fa6794c532

Resize the volume

openstack volume set 3f382414-b6ed-4499–8b06-a3fa6794c532 — size 40
Re-attach the volume and restart the server
openstack server add volume 68e9c4ba-1ad7–44f8-bb76–053ba1efa5fa 3f382414-b6ed-4499–8b06-a3fa6794c532
openstack server start 68e9c4ba-1ad7–44f8-bb76–053ba1efa5fa

Now when you run volume list you should see 40GiB, and also running fdisk -l shows the available disk is 40GiB. We have successfully grown the volume to desired size, But Wait! we have not grown the Physical volume, logical volume and filesystem.

fdisk -l
Disk /dev/vdb: 42.9 GB, 42949672960 bytes, 83886080 sectors
Units = sectors of 1 * 512 = 512 bytes
Sector size (logical/physical): 512 bytes / 512 bytes
I/O size (minimum/optimal): 512 bytes / 512 bytes
Disk label type: dos
Disk identifier: 0x00094295

Step two, Logical Volume extending

Lets run PVS(Physical volume) vgs(volume group) and lvs(logical volme) command .
previously running df -h , we have seen there are no space in our virtual disk.
Running pvs command shows us there is 0 free space in physical volume
sudo pvs
PV | VG |Fmt |Attr |PSize |PFree
/dev/vdb1| docker-vol |lvm2 | a |- | <15.00g 0
Running vgs also shows there is no free space available in volume group
sudo vgs
 VG #PV #LV #SN Attr VSize VFree
 docker-vol 1 1 0 wz — n- <15.00g 0
Running lvs shows there is one logical volume which is again full.
sudo lvs
 LV VG Attr LSize Pool Origin Data% Meta% Move Log Cpy%Sync Convert
 dockerlv docker-vol -wi-ao — — <15.00g
So in order to extend this we need to add a physical volume and then extend the volume group .By doing this we get enough space to extend the logical volume and regrow the filesystem.
First step, add physical volume (if you want to modify existing physical volume then you delete the partition and recreate new pv with new size and you will skip the vgextened (volume extend step)

Step three, Add Physical Volume

In my case I have docker volume mapped to /dev/vdb1 .
running fdisk -l shows me that /dev/vdb is now 40Gib, since we ran volume resize
Disk /dev/vdb: 42.9 GB, 42949672960 bytes, 83886080 sectors
Units = sectors of 1 * 512 = 512 bytes
Sector size (logical/physical): 512 bytes / 512 bytes
I/O size (minimum/optimal): 512 bytes / 512 bytes
Disk label type: dos
Disk identifier: 0x00094295
So I know I have resized the volume to 40GiB and I have extra space available in /dev/vbd

Lets create partition /dev/vbd2

sudo fdisk /dev/vdb
Welcome to fdisk (util-linux 2.23.2).
Changes will remain in memory only, until you decide to write them.
Be careful before using the write command.
Command (m for help): n
Partition type:
 p primary (1 primary, 0 extended, 3 free)
 e extended
Select (default p): p
Partition number (2–4, default 2): 2
First sector (31457280–83886079, default 31457280): 
Using default value 31457280
Last sector, +sectors or +size{K,M,G} (31457280–83886079, default 83886079): 
Using default value 83886079
Partition 2 of type Linux and of size 25 GiB is set
Command (m for help): t
Partition number (1,2, default 2): 2
Hex code (type L to list all codes): 8e
Changed type of partition ‘Linux’ to ‘Linux LVM’ 
Command (m for help): w
The partition table has been altered!
Now running fdisk , displays dev/vdb1 and /dev/vbd2
sudo fdisk -l
……
.….
Device Boot Start End Blocks Id System
/dev/vdb1 2048 31457279 15727616 8e Linux LVM
/dev/vdb2 31457280 83886079 26214400 8e Linux LVM
We successfully created partition. But the partition won’t be available until next boot,Kernel is still reading from old table… partprobe to rescue.
Run partprobe to inform the OS of partition table changes without reboot.
sudo partprobe -s
/dev/vda: msdos partitions 1
/dev/vdb: msdos partitions 1 2

Now partition is available for us to create the physical volume.

sudo pvcreate /dev/vdb2
Physical volume “/dev/vdb2” successfully created.
Running pvs command shows the new physical volume without any volume group associated with it
sudo pvs
 PV VG Fmt Attr PSize PFree 
 /dev/vdb1 docker-vol lvm2 a — <15.00g 0  /dev/vdb2 lvm2 — — 25.00g 25.00g

Step four, Extending the Volume Group by adding the new created physical volume (pv)

vgextend — Add physical volumes to a volume group
vgextend docker-vol /dev/vdb2
Checking volume groups with vgs command. We can clearly see we have two pv’s under group docker -vol
sudo vgs
 VG #PV #LV #SN Attr VSize VFree
 docker-vol 2 1 0 wz — n- 39.99g 0
But running df -h still shows 15GiB.
/dev/mapper/docker — vol-dockerlv 15G 1.9G 14G 13% /var/lib/docker
df -h
Filesystem Size Used Avail Use% Mounted on
/dev/vda1 30G 13G 18G 43% /
devtmpfs 7.8G 0 7.8G 0% /dev
tmpfs 7.8G 0 7.8G 0% /dev/shm
tmpfs 7.8G 1.4M 7.8G 1% /run
tmpfs 7.8G 0 7.8G 0% /sys/fs/cgroup/dev/mapper/docker — vol-dockerlv 15G 1.9G 14G 13% /var/lib/docker
tmpfs 1.6G 0 1.6G 0% /run/user/1000

Step five, resize logical volume

Because we still have to resize logical volume by running lvresize to grow 100%
sudo lvresize -l +100%FREE /dev/mapper/docker — vol-dockerlv'
 Size of logical volume docker-vol/dockerlv changed from <15.00 GiB (3839 extents) to 39.99 GiB (10238 extents).
 Logical volume docker-vol/dockerlv successfully resized.

Step six, grow the file system

After resizing logical volume , now we need to grow the file-system, using either xfs_growxfs or resize2fs , depending on your underlying filesystem.
sudo xfs_growfs /dev/mapper/docker — vol-dockerlv
meta-data=/dev/mapper/docker--vol-dockerlv isize=512    agcount=4, agsize=982784 blks
         =                       sectsz=512   attr=2, projid32bit=1
         =                       crc=1        finobt=0 spinodes=0
data     =                       bsize=4096   blocks=3931136, imaxpct=25
         =                       sunit=0      swidth=0 blks
naming   =version 2              bsize=4096   ascii-ci=0 ftype=1
log      =internal               bsize=4096   blocks=2560, version=2
         =                       sectsz=512   sunit=0 blks, lazy-count=1
realtime =none                   extsz=4096   blocks=0, rtextents=0
data blocks changed from 3931136 to 10483712
Now running df-h, you should see the docuker volume is fully grown to 40GiB
df -h
Filesystem Size Used Avail Use% Mounted on
/dev/vda1 30G 13G 18G 43% /
devtmpfs 7.8G 0 7.8G 0% /dev
tmpfs 7.8G 0 7.8G 0% /dev/shm
tmpfs 7.8G 1.4M 7.8G 1% /run
tmpfs 7.8G 0 7.8G 0% /sys/fs/cgroup/dev/mapper/docker — vol-dockerlv 40G 1.9G 39G 5% /var/lib/docker
tmpfs 1.6G 0 1.6G 0% /run/user/1000
That’s all folks!

Wednesday, June 13, 2018

Export All Prometheus data to CSV file

We can query Prometheus data via API.  for an example to query data for metric named CPU,  you can use following API
http://prom_server:9090/api/v1/query?query=cpu
or if you need  data for past 1 hour then add filters like  [1h] or [1m]  etc.
http://prom_server:9090/api/v1/query?query=cpu[1h]

sample output 
{"status":"success","data":{"resultType":"vector","result":[{"metric":{"__name__":"collectd_cpu","cpu":"0","instance":"overcloud-cephstorage-0.localdomain","job":"collectd","service":"idle"},"value":[1528895820.304,"2033227691"]},
 
 
Now this is very tedious job if we have 100's of metrics and if need to go over each metric names and query them individually and export to a file .
 
So I used a python script based on Robust Perception blog on query result as CSV.
https://www.robustperception.io/prometheus-query-results-as-csv/
 and  modified the script to query all metric names and then query individual metrics with this list of metric names and save to a file.
 
Now this can be run as cron job configured to run hourly. The python script will get last 1 hours of data and put it in a archive file.

python prom_csv.py http://prom_server:9090 | gzip > $(date +"%Y_%m_%d_%I_%M_%p")_metrics.gz
 
Python Script
 
import csv
import requests
import sys
def GetMetrixNames(url):
    response = requests.get('{0}/api/v1/label/__name__/values'.format(url))
    names = response.json()['data']

    #Return metrix names
    return names


"""
Prometheus hourly data as csv.
"""
writer = csv.writer(sys.stdout)

if len(sys.argv) != 2:
    print('Usage: {0} http://localhost:9090'.format(sys.argv[0]))
    sys.exit(1)
metrixNames=GetMetrixNames(sys.argv[1])

writeHeader=True
for metrixName in metrixNames:
     #now its hardcoded for hourly
     response = requests.get('{0}/api/v1/query'.format(sys.argv[1]),
      params={'query': metrixResult+'[1h]'})
      results = response.json()['data']['result']
      # Build a list of all labelnames used.
      #gets all keys and discard __name__
      labelnames = set()
      for result in results:
          labelnames.update(result['metric'].keys())
      # Canonicalize
      labelnames.discard('__name__')
      labelnames = sorted(labelnames)
      # Write the samples.
      if writeHeader:
          writer.writerow(['name', 'timestamp', 'value'] + labelnames)
          writeHeader=False
      for result in results:
          l = [result['metric'].get('__name__', '')] + result['values']
          for label in labelnames:
              l.append(result['metric'].get(label, ''))
              writer.writerow(l)
 
 
I hope this helps someone  


Thursday, November 9, 2017

Benchmarking Kafka for NFV work


Benchmarking Kafka  Message Queue Latency

Summary

The purpose of this blog is to show the results of messaging queue latency using Kafka.
The testing to measure the latency is achieved  by making use of  kafka library written in c language and installing kafka in cluster mode with zookeeper to manage configuration.
Kafka default configuration was modified to achieve this result(See Kafka Producer and Consumer Configurations section)


The latency is measured by sending messages effectively in variable rate , received them by consumer and recorded the end to end latency at consumer end.

The first test was done only running producer and consumer without generating traffic on the same bus. And then modified test to capture  latency with  added bus traffic with various speed and configuration changes.

In overall test result, it shows that kafka is good candidate for low latency messaging in comparison with rabbitMQ and and other  messaging service.
Also was noted that , Kafka latency gets hit when more partitions are added to the topic.
More partitions and more replication factors  increases latency.

Here Event topic is created with 1 partitions and 3 replication factor with guaranteed message delivery to consumer and Telemetry or general traffic  topic is created without any replication.

Conclusion
Based on various test result, the high latency achievable setup is to have
  • EVENT, topic created with single partition and Replication factor equal to no of brokers in Cluster, with batch size of 0, and acknowledgement set to 1.
  • TRAFFIC, topic created with partitions number equal to no of nodes  and each producer generating messages with unique partition key with acknowledgement set to 0 and batch size set to 0.
  • TRAFFIC message are generated at the rate of  <=1 sec
  • EVENT traffic generated as and when event is captured
  • TRAFFIC consumer are grouped by same groupid(high performance)
  • EVENT consumer are unique instances without any groupid assigned
Comparing EVENT latency for different acknowledgment setting with Metrics Topic partitioned with Key name and without key name
ACK 1:Metrics without key
ACK -1: Metrics without key
ACK 1: Metrics With Key
ACK -1 Metrics With Key
17.51
14.474
2.29
2.107
117.604
23.138
2.5155
2.3135
229.4404
224.7512
4.0073
3.5732
427.1938112
408.2698984
19.0023534
17.4909006


Comparing different acknowledgment setting without any metrics

Percentile
(*)No Metrics 1P/3RF-ACK(-1)
(**) No Metrics -1P/3RF- ACK(0)
(**) No Metrics -1P/3RF- ACK(1)
0.9
2.43
1.88
1.91
0.95
2.625
1.93
1.96
0.99
3.671
2.0464
2.04
0.99999
16.609606
6.1931184
11.7625396

Setup

Kafka is installed  in cluster mode , with zookeeper running as 3 (n-1) node cluster and 3 brokers  (n-1) availability mode and auto-create topics with 3 partition, so we can have 3 client for each topic per group.
For testing purpose we have use two topics “EVENT” and “TRAFFIC”

Kafka Topic

Every topic partition in Kafka is replicated n times, where n is the replication factor of the topic. This allows Kafka to automatically failover to these replicas when a server in the cluster fails so that messages remain available in the presence of failures.

EVENT Topic : Used to capture events via collectd D, this topic is created with 1 Partitions and 3 replication factor.

TRAFFIC Topic: This topic is used for telemetry data . This load on the event producers and consumers are tested with various combination of traffic topics
Events latency measured with
  1. Traffic topic of 1 partition and 1 replication factor
  2. Trafic topic with 700 partitions and 1 replication factor
  3. Traffic topic with 700 partitions with keyname and 1 replication factor

Important Client / Producer Configurations:

Kafka Producer and Consumer Configurations

In order to achieve low latency, following configuration are required for producer and consumers.
For more details about configurations , please refer to this link

Producer

/* Producer config */
rd_kafka_conf_set(conf, "queue.buffering.max.messages", "500000",NULL, 0);
rd_kafka_conf_set(conf, "queue.buffering.max.ms", "0",NULL, 0);
rd_kafka_conf_set(conf, "batch.num.messages", "0",NULL, 0);
rd_kafka_conf_set(conf, "message.send.max.retries", "3", NULL, 0);
 rd_kafka_conf_set(conf, "retry.backoff.ms", "0", NULL, 0);
 rd_kafka_conf_set(conf, "offset.store.method", "broker", NULL, 0);

Consumer

rd_kafka_conf_set(conf, "queued.min.messages", "1000000", NULL, 0);
rd_kafka_conf_set(conf, "session.timeout.ms", "12000", NULL, 0);
rd_kafka_conf_set(conf, "fetch.wait.max.ms", "10000", NULL, 0);
rd_kafka_conf_set(conf, "fetch.error.backoff.ms", "0", NULL, 0);
rd_kafka_conf_set(conf, "fetch.min.bytes","1",NULL,0);
rd_kafka_conf_set(conf, "num.consumer.fetchers","10",NULL,0);

The most important producer configurations:

compression
The compression type for all data generated by the producer. The default is none (i.e. no compression). Valid values are none, gzip, snappy, or lz4. Compression is of full batches of data, so the efficacy of batching will also impact the compression ratio (more batching means better compression).
Name: compression.type Default: None

sync vs async production
Batching is one of the big drivers of efficiency, and to enable batching the Kafka producer will attempt to accumulate data in memory and to send out larger batches in a single request.
Name: producer.type Default: sync
batch size (for async producers)
A small batch size will make batching less common and may reduce throughput (a batch size of zero will disable batching entirely). A very large batch size may use memory a bit more wastefully as we will always allocate a buffer of the specified batch size in anticipation of additional records.
Name: batch.size Default: 0

maximum message size
This is largest message size Kafka will allow to be appended to this topic. Note that if you increase this size you must also increase your consumer's fetch size so they can fetch messages this large.
Account for this when doing disk sizing. Average Message size+Retention Period * Replication factor
Name: max.message.bytes Default: 1,000,000

Acks
The topic is tested for different acks setting .  Acks =1 is ideal case to improve latency .
The number of acknowledgments the producer requires the leader to have received before considering a request complete. This controls the durability of records that are sent. The following settings are common:
acks=0 If set to zero then the producer will not wait for any acknowledgment from the server at all. The record will be immediately added to the socket buffer and considered sent. No guarantee can be made that the server has received the record in this case, and the configuration will not take effect (as the client won't generally know of any failures). The offset given back for each record will always be set to -1.
acks=1 This will mean the leader will write the record to its local log but will respond without awaiting full acknowledgement from all followers. In this case should the leader fail immediately after acknowledging the record but before the followers have replicated it then the record will be lost.
acks=all This means the leader will wait for the full set of in-sync replicas to acknowledge the record. This guarantees that the record will not be lost as long as at least one in-sync replica remains alive. This is the strongest available guarantee.
Name: acks Default: 1

Number of partitions for a topic

Number of topics and partitions impact how much can be stored in page cache
Topic/Partition is unit of parallelism in Kafka
Partitions in Kafka drives the parallelism of consumers
For “EVENT” topic partition is set to 1 and for “Telemetry” or “Traffic” partition is equal to number for producers.


Java/JVM tuning

  • Minimize GC pauses by using Oracle JDK it uses new G1 garbage-first collector
  • Kafka Heap Size
    • From HCC Article, by default kafka-broker jvm is set to 1Gb this can be increased using Ambari kafka-env template. When you are sending large messages JVM garbage collection can be an issue. Try to keep the Kafka Heap size below 4GB.
    • Example: In kafka-env.sh add following settings.
    • export KAFKA_HEAP_OPTS="-Xmx16g -Xms16g"
    • export KAFKA_JVM_PERFORMANCE_OPTS="-XX:MetaspaceSize=96m -XX:+UseG1GC -XX:MaxGCPauseMillis=20 -XX:InitiatingHeapOccupancyPercent=35 -XX:G1HeapRegionSize=16M -XX:MinMetaspaceFreeRatio=50 -XX:MaxMetaspaceFreeRatio=80"

Software

Installed versions.

Java-1.8.0-openjdk-devel.x86_64
Scala-2.10.3
Kafka_2.10-0.10.0.1
Broker listening at port 9092

Server Details

MemTotal:    131744948 kB
Architecture:       x86_64
CPU op-mode(s):     32-bit, 64-bit
Byte Order:         Little Endian
CPU(s):             48
On-line CPU(s) list:   0-47
Thread(s) per core: 2
Core(s) per socket: 12
Socket(s):          2
NUMA node(s):       2
Vendor ID:          GenuineIntel
CPU family:         6
Model:              79
Model name:         Intel(R) Xeon(R) CPU E5-2650 v4 @ 2.20GHz
Stepping:           1
CPU MHz:            1682.484
BogoMIPS:           4411.71
Virtualization:     VT-x
L1d cache:          32K
L1i cache:          32K
L2 cache:           256K
L3 cache:           30720K
NUMA node0 CPU(s): 0-11,24-35
NUMA node1 CPU(s): 12-23,36-47


Test Case

  • (*)Event Producers publishes event data to “EVENT” topic at variable rate (1 to 10 messages per sec) of size 64 bytes. Message requires Acknowledgement from the broker before it is made available to consumers.(Brokers needs to complete writing to all replicated servers in the cluster)
  • Event Consumers are run in simple mode, Each consumer are run without group.
  • Traffic Producers publishes traffic 64KB sized data, every 1 sec(also test for 5 sec interval)
  • Traffic consumers are run under single group id, so brokers evenly distributes partitions to consumers.(High performance consumer)
    • In simple consumers, TRAFFIC consumers are run without groupid
  • Latency for Events  is measured under  following scenario
    • 1 even producers with acks(-1) and 1 event consumers
      • Topic partition set to 1 and replication factor 3 , message size 64bytes
    • 1 even producers with acks(0) and 1 event consumers
      • Topic partition set to 1 and replication factor 3 , message size 64bytes
    • 1 even producers with acks(1) and 1 event consumers  (default)
      • Topic partition set to 1 and replication factor 3 , message size 64bytes

    • Run 1 event produces (*) and 1 event consumer
      • Without any other  traffic  on the same bus.
      • Run 1 Traffic Producer and 1 Traffic Consumer at 1 sec and 5 sec interval to “TRAFFIC” topic with 1 partition and 1 replication factor
      • Run 600 Traffic Producer and 4 Traffic Consumer at 1 sec and 5 sec interval to “TRAFFIC” topic with 500 partition and 1 replication factor
      • Run 700 Traffic Producer and 4 Traffic Consumer at 1 sec and 5 sec interval to “TRAFFIC” topic with 700 partition with unique keyname for each partition and 1 replication factor.
    • Run 1 event produces  with ack (1) and 1 event consumer(default)
      • Run 700 Traffic Producer and 4 Traffic Consumer at 1 sec and 5 sec interval to “TRAFFIC” topic with 700 partition and 1 replication factor

Installing Kafka and ZooKeeper

  1. Install  java Java-1.8.0-openjdk-devel.x86_64
  2. Install scala
    1. wget http://www.scala-lang.org/files/archive/scala-2.10.3.rpm -O scala-2.10.3.rpm
    2. rpm -ivh scala-2.10.3.rpm
  3. Download Kafka
    1. wget http://www.us.apache.org/dist/kafka/0.10.0.1/kafka_2.10-0.10.0.1.tgz -O kafka_2.10-0.10.0.1.tar.gz
    2. tar -xvzf kafka_2.10-0.10.0.1.tar.gz
    3. mv kafka_2.10-0.10.0.1 /usr/share/kafka
  4. Update iptables on all brokers(Kafka installed server)
    1. iptables -I INPUT -p tcp -m tcp --dport 3888 -m comment --comment 'zookeeper 3888' -j ACCEPT
    2. iptables -I INPUT -p tcp -m tcp --dport 2888 -m comment --comment 'zookeeper 2888' -j ACCEPT
    3. iptables -I INPUT -p tcp -m tcp --dport 2181 -m comment --comment 'zookeeper 2181' -j ACCEPT
    4. /sbin/service iptables save
  5. Refer changes for  zookeeper and server propers from here
    1. https://gist.github.com/aneeshkp/013d51cdc64606079835319d3e70061e
  6. Configure  Zookeeper
    1. touch /var/zookeeper/data/myid
    2. echo 1 >> /var/zookeeper/data/myid
    3. Run zookeeper from command line
$cd  /usr/share/kafka/
$bin/zookeeper-server-start.sh  config/zookeeper.properties

(to run as service)
[Unit]
Description=Zookeeper Service
[Service]
Type=simple
User=root
ExecStart= /usr/share/kafka/bin/zookeeper-server-start.sh  /usr/share/kafka/config/zookeeper.properties
[Install]
WantedBy=multi-user.target

  1. Run Kafka
    1. $cd  /usr/share/kafka/
    2. $ bin/kafka-server-start.sh  config/server.properties
  2. Create Topic for testing
    1. Event topic
      1.  sh kafka-topics.sh --create --zookeeper 10.19.110.7:2181,10.19.110.9:2181,10.19.110.11:2181 --partition 3 --replication-factor 3 --topic EVENT
    2. Traffic Topic
      1. Single partition 1 replication factor
        1. sh kafka-topics.sh --create --zookeeper 10.19.110.7:2181,10.19.110.9:2181,10.19.110.11:2181 --partition 1 --replication-factor 1 --topic TRAFFIC
      2. 700 partitions 1 replication factor
        1. sh kafka-topics.sh --create --zookeeper 10.19.110.7:2181,10.19.110.9:2181,10.19.110.11:2181 --partition 700 --replication-factor 1 --topic TRAFFIC700


Test Client and Scripts

C client library librdkafka is used for testing latency .  https://github.com/edenhill/librdkafka
librdkafka - the Apache Kafka C/C++ client library. ibrdkafka is a C library implementation of the Apache Kafka protocol, containing both Producer and Consumer support.
Kafka is written in scala and java client  performs better than python client, but according to Confluent C++ library performs better than java and hence we opted to use C library instead of java client.

Python Client
There are three major python clients for kafka pykafka, python-kafka and confluent-kafka-client You can refer to those clients here
http://activisiongamescience.github.io/2016/06/15/Kafka-Client-Benchmarking/

All available clients
Benchmarking reference


Source for scripts used for  testing.
Source
  1. Used modified version  for client example from librdkafka c library
     Download librdkafka library from https://github.com/edenhill/librdkafka and copy    rdkafka_performance4.c and rdkafka_performance3.c to src folder and compile
  
For event producer and consumer
    $gcc -lrdkafka -lz -lpthread -lrt rdkafka_performance4.c  -o rdkafka_performance4
For traffic producer and consumer
    $gcc -lrdkafka -lz -lpthread -lrt rdkafka_performance3.c  -o rdkafka_performance3

2.  set the environmental variable LD_LIBRARY_PATH
     LD_LIBRARY_PATH=/usr/local/lib
:q
    export LD_LIBRARY_PATH
3.Create topics in brokers (** explained in installation steps)
  >login to broker server and navigate to bin folder
sh kafka-topics.sh --create --zookeeper localhost:2181 --replication-factor 3 --partitions 3 --config retention.ms 12000 --topic telemetry_topic

EVENT
  1. Event Producer script
    $~/librdkafka/src/rdkafka_performance4 -P -t EVENT -a -1 -b               10.19.110.7:9092,10.19.110.9:9092,10.19.110.11:9092 -c 5000   -l -s 64

Arguments
-P is for producer
-t TOPIC_NAME
-a -1 , required acks
-b list of brokers
-c message count
-l latency stats
-s size of message

  1. Event Consumer script
$~/librdkafka/src/rdkafka_performance4 -C -t topic_name -p 0 -o end -b 10.19.110.7:9092,10.19.110.9:9092,10.19.110.11:9092 -u -l

Arguments:
-C consumer
-t topic_name
-p 0 , partition since we create EVENT topic with one partition , consumer will only consume from partition0
-u Output stats in table format

TRAFFIC
  1. Traffic Producer script. On each server creates 100 producers
             for i in $(1..100); do
                    ~/rdkafka_performance3 -P -t traffic_topic_name -M -a 0  -b        10.19.110.7:9092,10.19.110.9:9092,10.19.110.11:9092  -B 1 -r 1 -s 64000;
             done
2. Traffic Consumer script
~/rdkafka_performance3 -G group-id-t traffic_topic_name  -o end -b 10.19.110.7:9092,10.19.110.9:9092,10.19.110.11:9092  -u -l

-G groupid , has to be same for all consumers , so that brokers can balance partitions among consumers(Consumers cannot be more than partitions)

Measuring Latency

Message  latency is measured by adding wall_clock to the message before sending to broker and consumer  prints difference on arrival.


With No Traffic

Here Event latency is measured without any telemetry type of traffic is generated in the background while measuring latency .
In this test case, no traffic producers and consumer were running. Single producer and single consumer is running with EVENT topic is created with 1 partitions and 3 replication factor.
With different Acknowledgement factor
Producer
$~/librdkafka/src/rdkafka_performance4 -P -t EVENT -a -1 -b               10.19.110.7:9092,10.19.110.9:9092,10.19.110.11:9092 -c 5000   -l -s 64
Consumer
$~/librdkafka/src/rdkafka_performance4 -C -t topic_name -p 0 -o end -b 10.19.110.7:9092,10.19.110.9:9092,10.19.110.11:9092 -u -l

1 partition, 3 Replication factor comparing with 3 different types of acknowledgment setting


Percentile
1P/3RF-ACK(-1)
1P/3RF- ACK(0)
1P/3RF- ACK(1)
0.9
2.43
1.88
1.91
0.95
2.625
1.93
1.96
0.99
3.671
2.0464
2.04
0.99999
16.609606
6.1931184
11.7625396


ACK(-1) : 1 partition 3 RF

acks=-1 This means the leader will wait for the full set of in-sync replicas to acknowledge the record. This guarantees that the record will not be lost as long as at least one in-sync replica remains alive. This is the strongest available guarantee.


ACK(0) : 1 partition 3 RF

acks=0 If set to zero then the producer will not wait for any acknowledgment from the server at all. The record will be immediately added to the socket buffer and considered sent. No guarantee can be made that the server has received the record in this case, and the configuration will not take effect (as the client won't generally know of any failures). The offset given back for each record will always be set to -1.


ACK(1) : 1 partition 3 RF

acks=1 This will mean the leader will write the record to its local log but will respond without awaiting full acknowledgement from all followers. In this case should the leader fail immediately after acknowledging the record but before the followers have replicated it then the record will be lost.


Comparing between Replication Factor set to 1 and 3


With Traffic

Here Event latency is measured with various types  of  telemetry type of traffic is generated in the background while measuring latency .

Comparing Latency with different types of traffic in the background with  ACK(-1) and ACK(1)


Event Latency measured  with the traffic with Event  ACK set to  all (-1)

To generate different traffic , “Telemetry” topic was created with  
  • Single partition and single Replication factor
  • 700 Partition and Single Replication factor

TRAFFIC: 7 Producers , 4 Consumers , Topic :Single partition and single Replication factor.

Consumers are consuming topic as individual instance. Every consumer reads all offsets of the topic.


Event Topic Latency chart


TRAFFIC: 7 Producers at 1 msg/sec , 4 simple Consumers , Topic :700 partition with  single Replication factor.


Test setup to measure EVENT  latency with traffic producers and  simple traffic consumers running in multiple partitions and instances mode. In Simple consumers, each instance belong to its own group, hence each consumer will subscribe to all partitions(700 Partitions)


TRAFFIC: 700 Producers at 1 msg/sec  , 4 high performance Consumers , Topic :700 partition with  single Replication factor.


Test setup to measure EVENT  latency with traffic producers and high performance consumers running in multiple partitions and instances mode

X Traffic Producers  writing to Y partitions with Z<=Y Consumers consuming messages.
In our test we used 600 producers with 700/500 partitions with key and without key.


Without partition Key


With partition key


Comparing Traffic


Percentile
(*)No Traffic 1P/3RF-ACK(-1)
(**) No Traffic -1P/3RF- ACK(0)
(**) No Traffic -1P/3RF- ACK(1)
No Traffic 1P/1RF
(*)7P/4C/1P/1RF
(*)Simple 7/700P
(*)700P/4C/700P:Group
(*)700P/4C/700P:GroupWithKey
0.9
2.43
1.88
1.91
1.183
1.99
1.96
14.474
2.107
0.95
2.625
1.93
1.96
1.4025
2.0805
2.02
23.138
2.3135
0.99
3.671
2.0464
2.04
1.9384
2.7524
2.6372
224.7512
3.5732
0.99999
16.609606
6.1931184
11.7625396
2.9245569
6.4719637
19.7113523
408.2698984
17.4909006


Latency collected with traffic for Event with  ACK all (1)

TRAFFIC: 700 Producers at 1 msg/sec  , 4 high performance Consumers , Topic :700 partition with  single Replication factor.


Without Unique Partition key for “TRAFFIC”  topic  messages produced by 700 producers and consumed by 4 consumer under same group (high performance).


With Unique Partition key for “TRAFFIC” topic topic  messages produced by 700 producers,
consumed by 4 consumer under same group (high performance).


Comparing Traffic with ACK(-1) and ACK(1) with 700 partitions with message producer using UNIQUE partition key and without UNIQUE partition key


Comparison of  Latency of “EVENT” topic produced with acknowledgment set to all(-1), and broker (1) , with “TRAFFIC” topic partition to 700 and message produced  with UNIQUE partition  key and Without UNIQUE  partition key


ACK 1:Metrics without key
ACK -1: Metrics without key
ACK 1: Metrics With Key
ACK -1 Metrics With Key
17.51
14.474
2.29
2.107
117.604
23.138
2.5155
2.3135
229.4404
224.7512
4.0073
3.5732
427.1938112
408.2698984
19.0023534
17.4909006

Openshift on Openstack : Resize attached docker volumes for Openshift nodes  Recently I deployed Openshift 3.9 on Openstack 10z and had ...